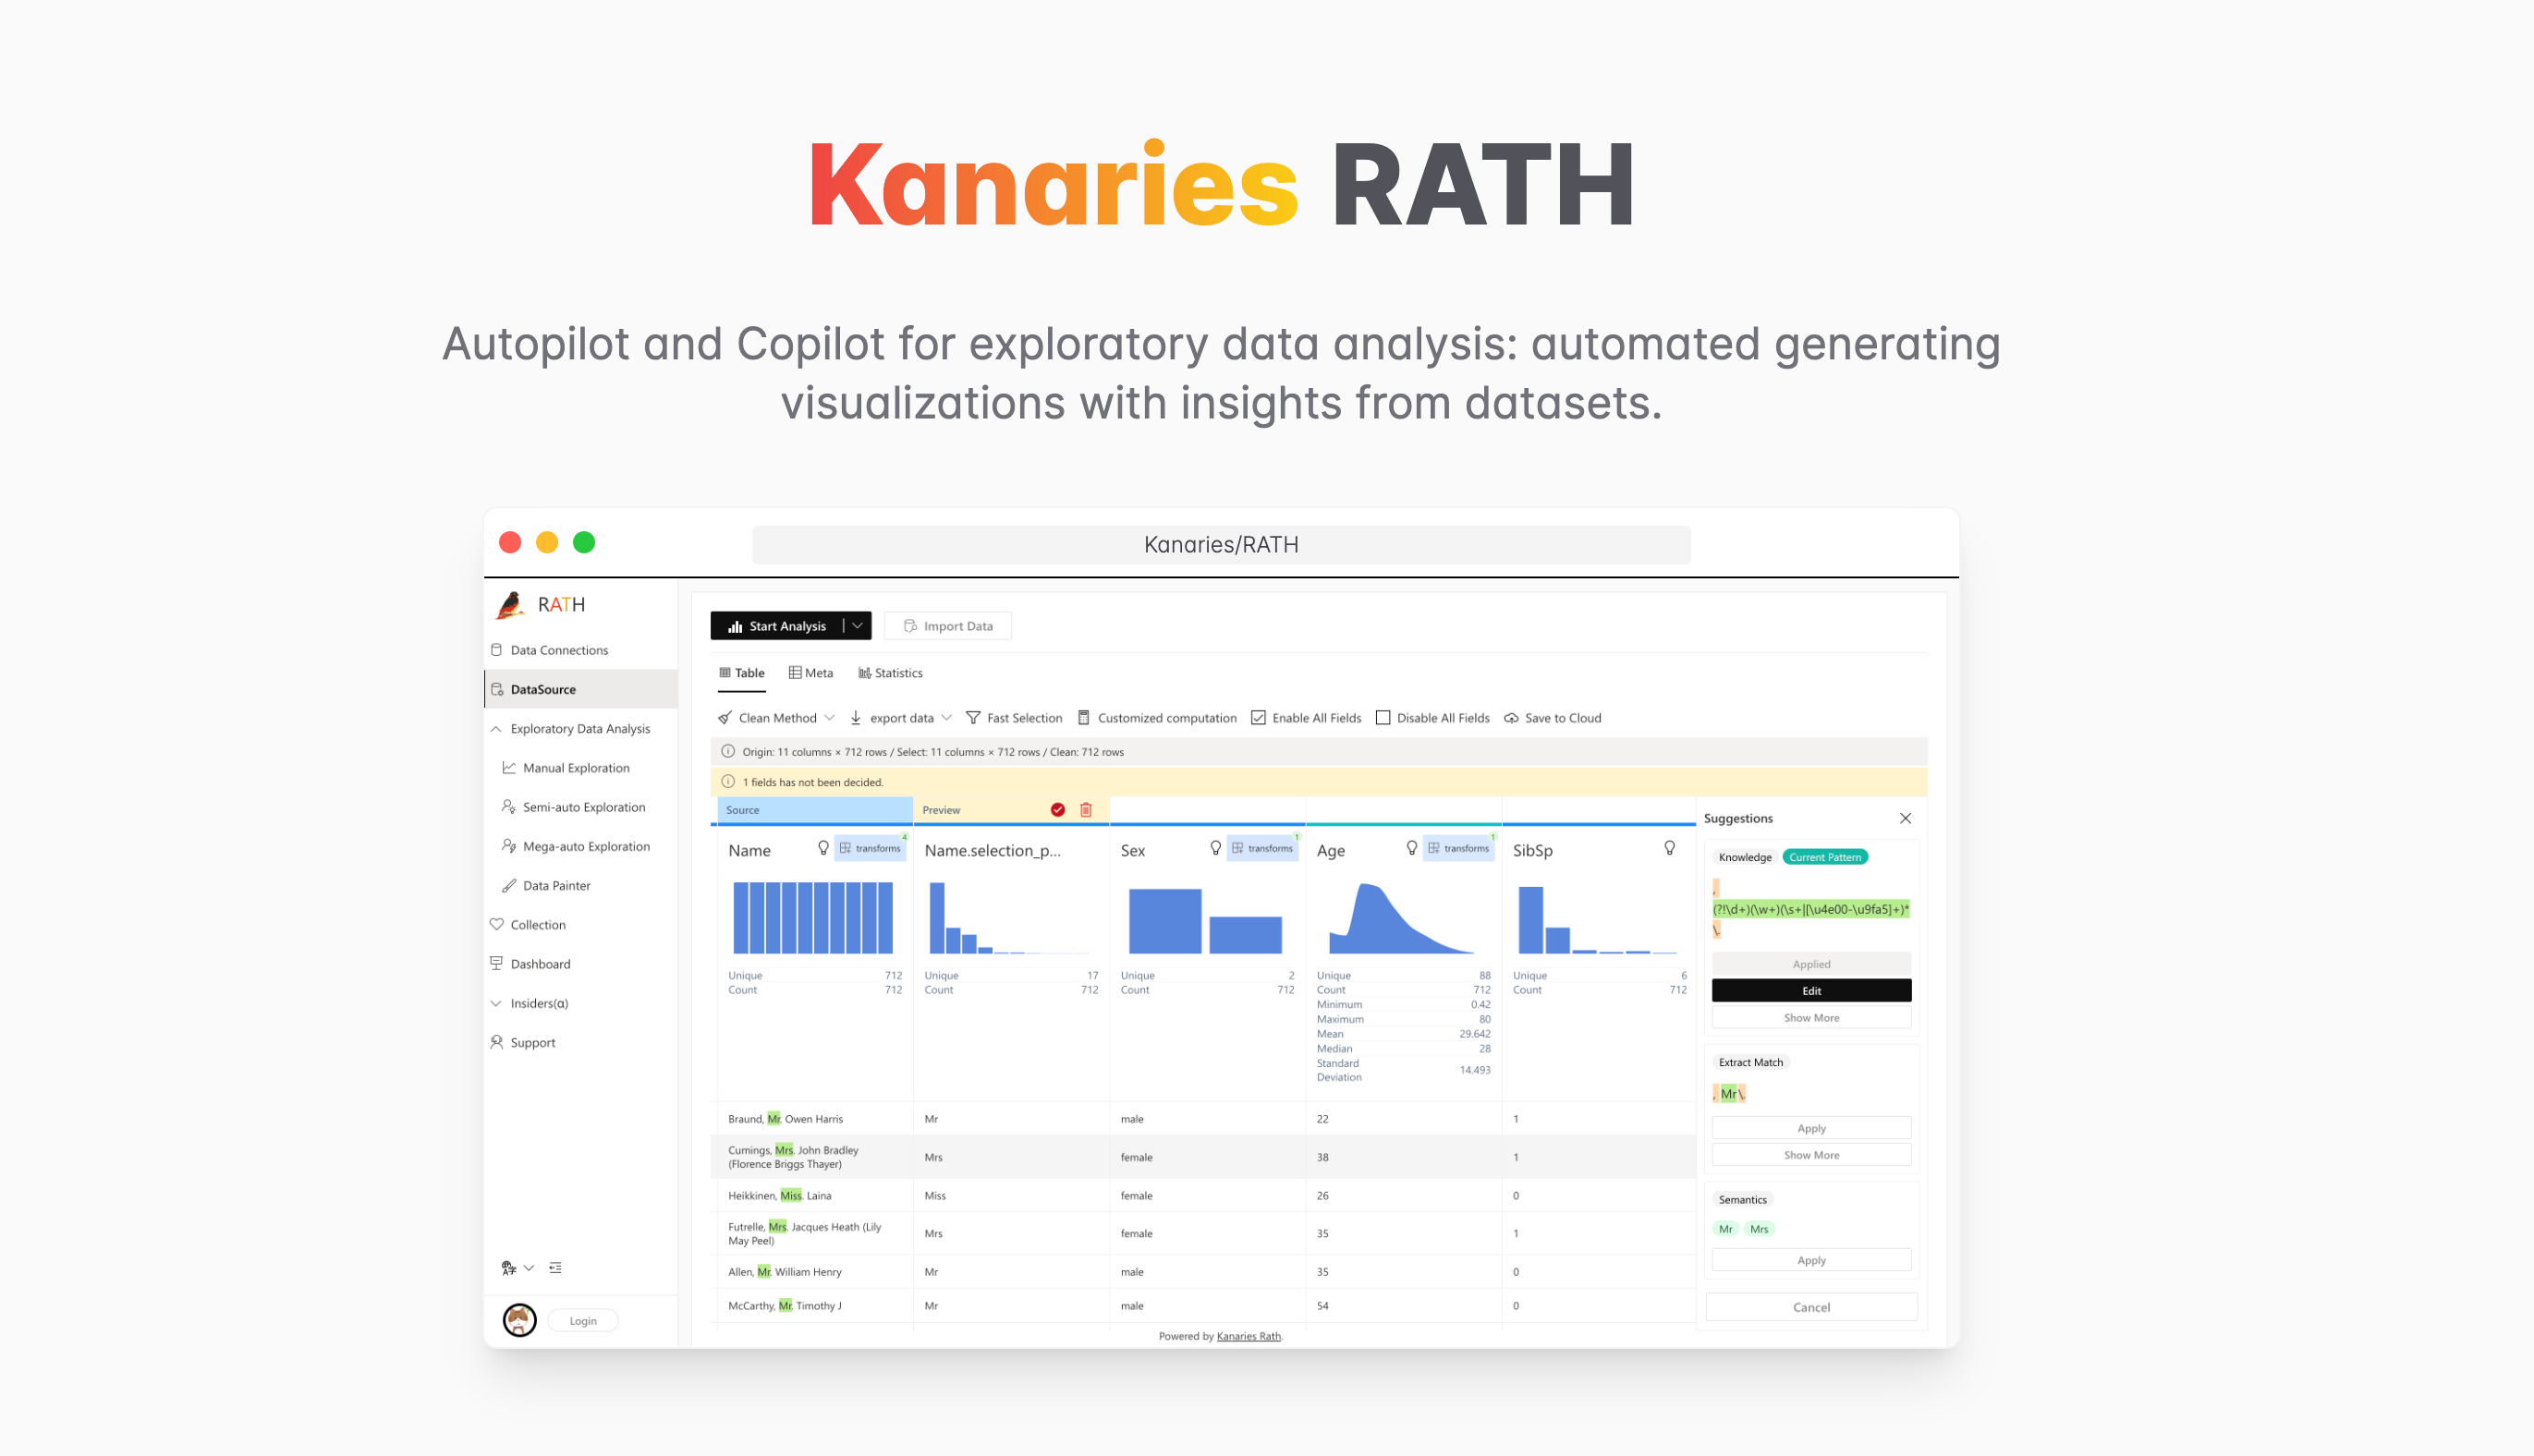
Practical Data Analysis: Open Source Automated Data Exploration Tool Rath

Introduction
Exploratory Data Analysis (EDA) is a task that data analysts or data scientists frequently need to complete when facing datasets. Using Python tools like Pandas and Seaborn can easily accomplish univariate analysis, bi-variate analysis, and multi-variate analysis, but using them for data exploration not only has certain technical barriers but also requires manually writing scripts for data operations and analysis. This article will introduce a very cool automated data exploration open source tool Rath, which can automatically complete EDA and become the Autopilot or Copilot of the data analysis world.
Installing Rath
Since Rath is still in rapid iteration and its documentation isn't very complete, the fastest way to experience it is through the demo website provided on the official site.
However, if you know some frontend technology, you can still install it locally, though the steps are slightly more cumbersome.
Before starting, ensure you have Node.js 16 and Yarn installed.
Prerequisites
First, download the source code for Rath 2.0.0 by executing the following command in a Bash terminal:
# download source code
wget https://github.com/Kanaries/Rath/archive/refs/tags/2.0.0.zip
Next, unzip the source code:
# unzip source code
unzip 2.0.0.zip
Then, we need to install the relevant dependencies:
# install dependencies
cd Rath-2.0.0
yarn install
Installing dependencies takes some time, please be patient.
After dependencies are installed, we need to build the project. Since it's built with Webpack, it will be slightly slower and requires a few minutes of patience:
# build project
yarn workspace rath-client build
After that, we can start Rath:
# start rath
yarn workspace rath-client start
During startup, the terminal will display Starting the development server... and open the default browser automatically navigating to http://localhost:3000, indicating the development server is starting.
After waiting a while, the terminal will show the following information:
webpack compiled with 3 errors and 54 warnings
No issues found.
This indicates compilation is complete and Rath service has started successfully!
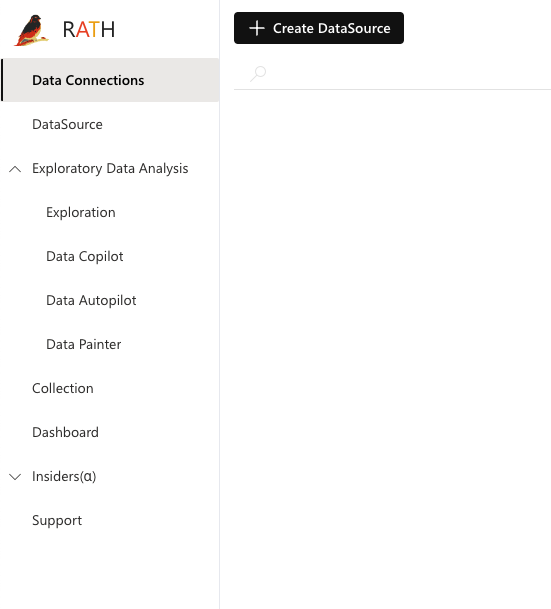
You should be able to see the following page at http://localhost:3000:
Importing Datasets
Now we can import datasets into Rath.
Click Create DataSource to see the following options:
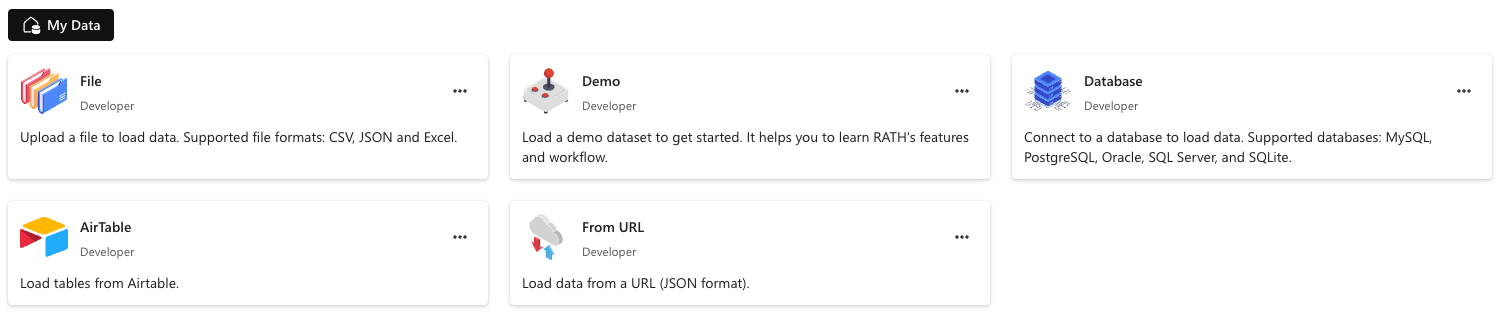
Of course, you can click Demo to select demonstration data, which thoughtfully includes many classic datasets like Bike Sharing, Titanic, Car Sales, etc.
In this experience, we'll use the Diamonds dataset from Kaggle, which has a total of 54k rows with few fields, most of which are numeric types.
Click File to import the downloaded Diamonds dataset:
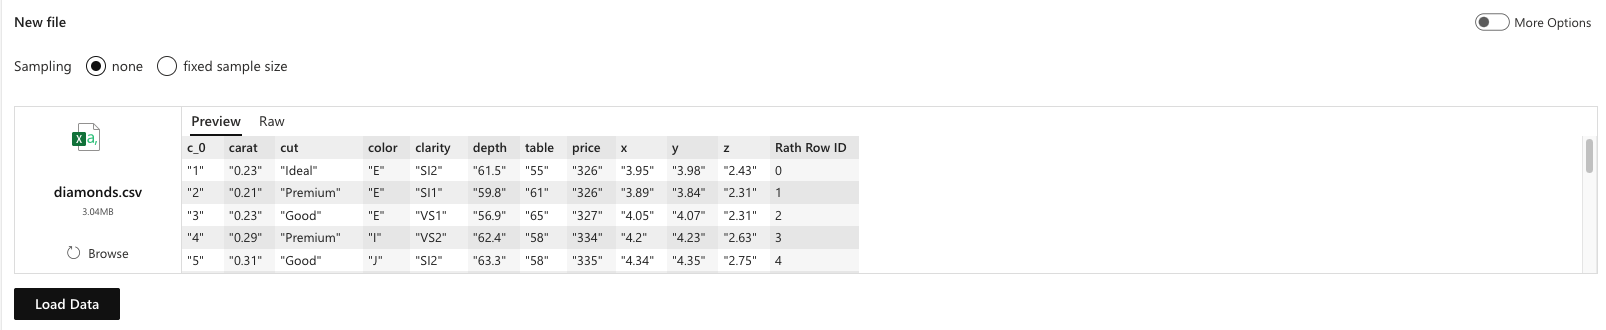
Click Load Data to load the data, and you can see the following Data Profiling interface:
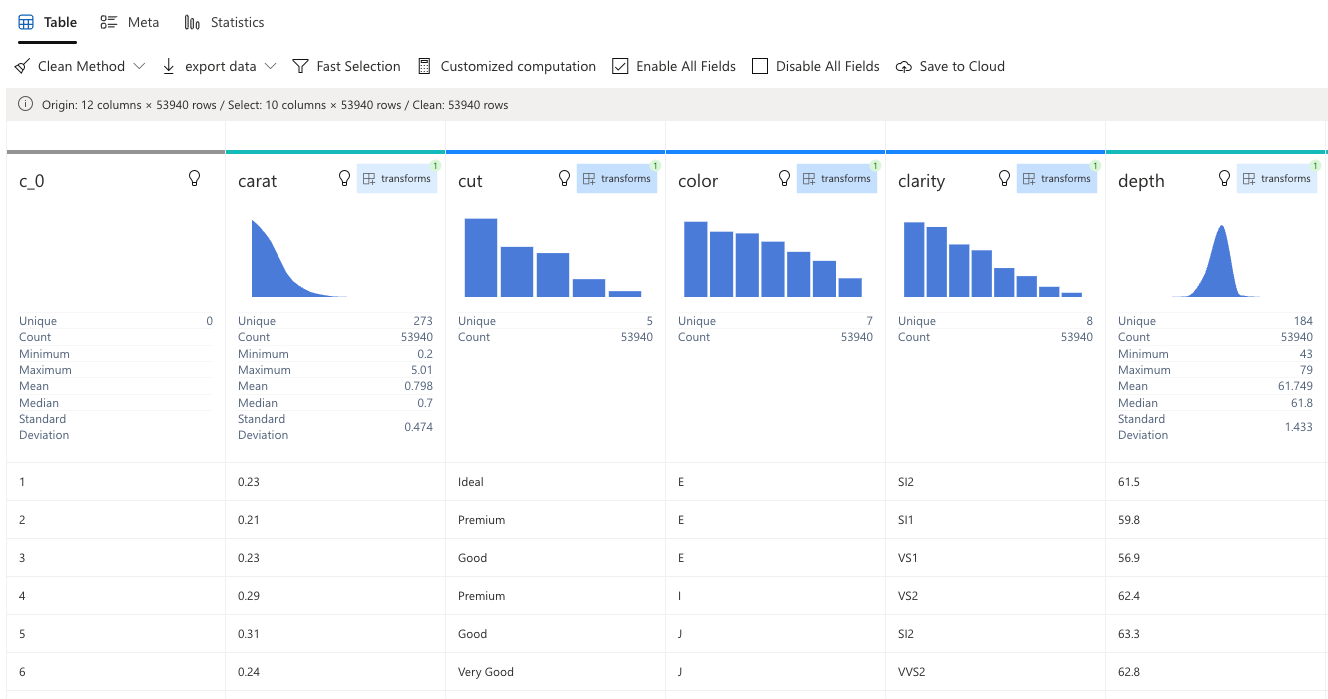
As you can see, Rath has thoughtfully created histograms for numeric fields, which is the first thing to do in exploratory data analysis EDA - univariate analysis.
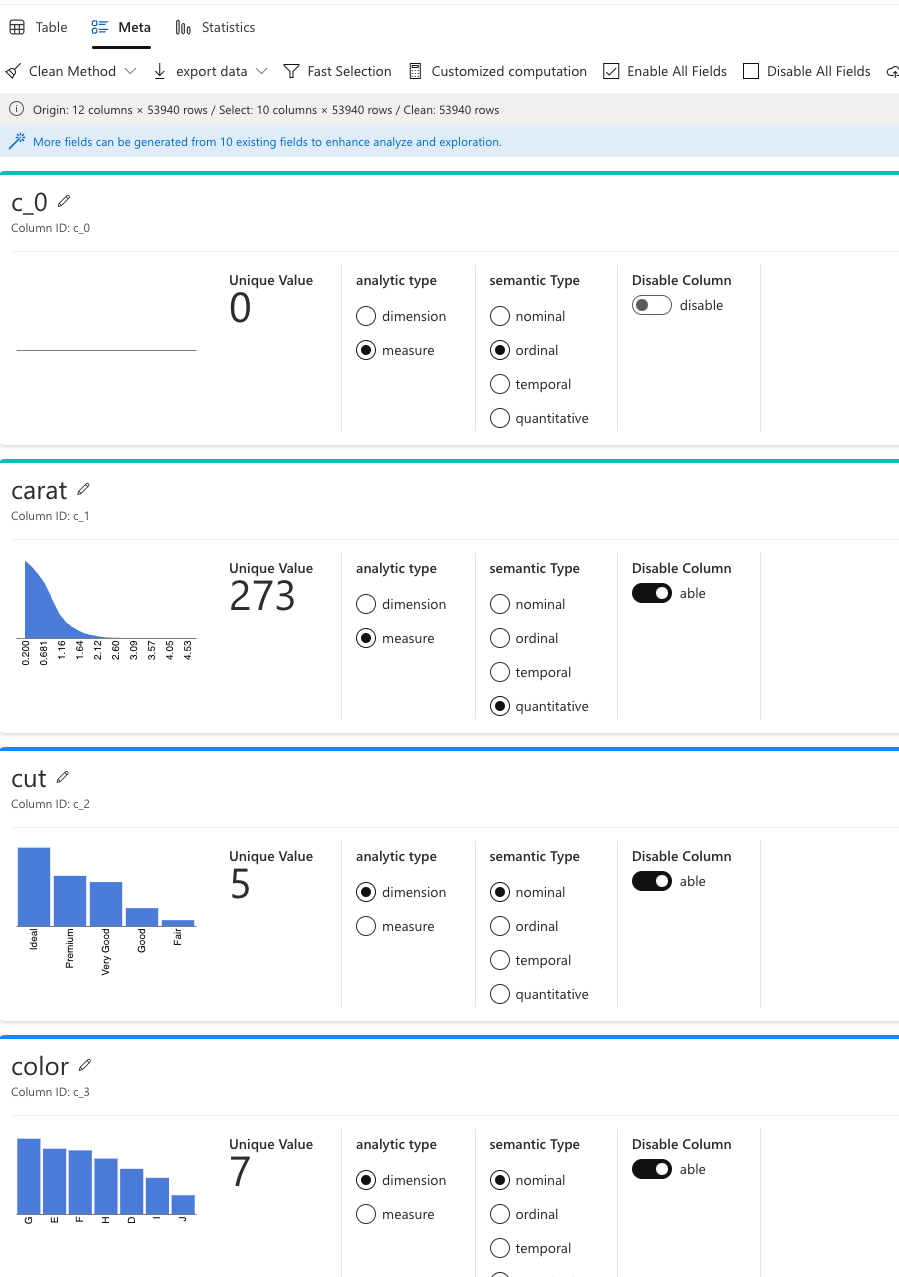
We can also click Meta to view detailed information about each field, where you can define whether you want to analyze it as a dimension or metric, and whether it's a numeric or discrete variable:
If we click Statistics, we can view more detailed information, such as the number of unique values for discrete variables, statistical data like mean, median, standard deviation, etc.:
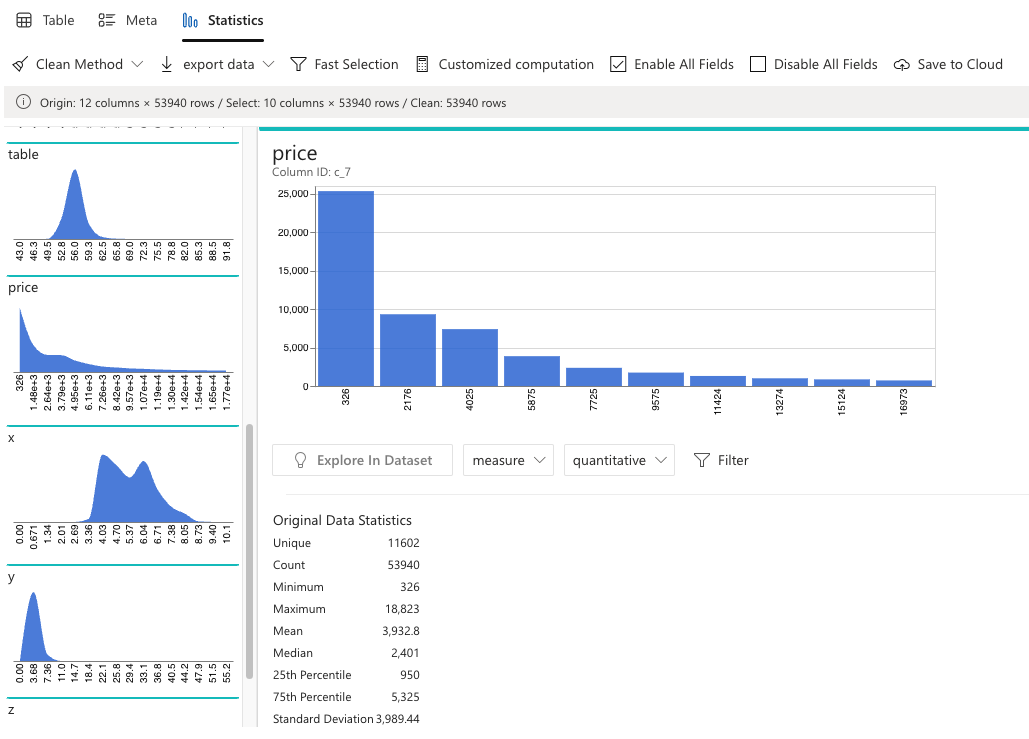
Additionally, we can see data distribution through histograms. For example, prices in the Diamonds dataset clearly show a long-tail distribution, while the x variable shows a bimodal distribution.
Automated Data Exploration
Rath's characteristic is automated data exploration. Let's see how this magical feature works.
Click Data Autopilot, then click Re-Run Task to get the automatically generated histograms, scatter plots, and box plots below:
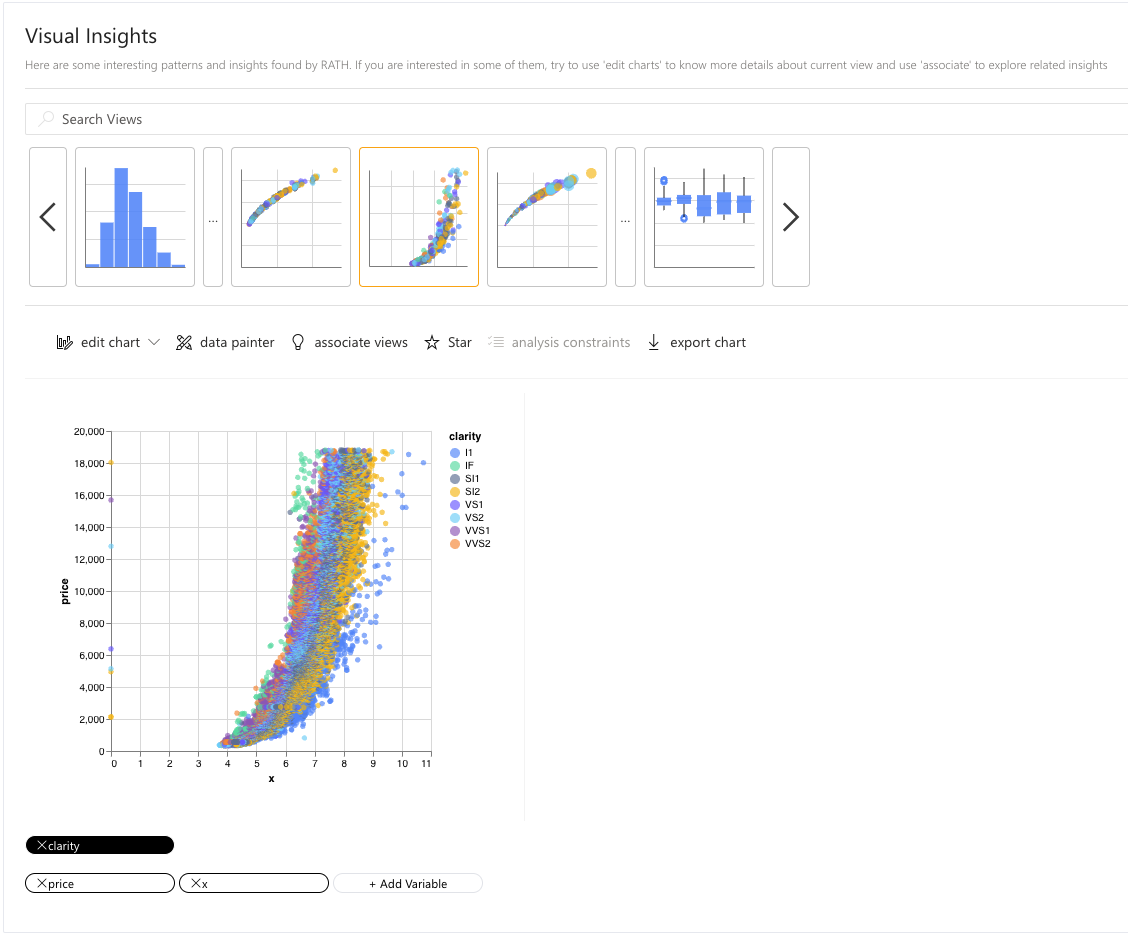
From the multi-variate analysis charts automatically generated by Rath, we can find many valuable patterns. For example, from the above chart, we can see that diamonds with high clarity have relatively smaller x values; and as carat increases, price also rises in a logarithmic curve.
Drag-and-Drop Analysis
Rath also supports Superset-style drag-and-drop analysis, similar to Superset introduced in the previous article "Practical Data Analysis: Building a Self-Service Data Analytics Platform with Open Source Superset." Through simple dragging, you can generate corresponding charts:
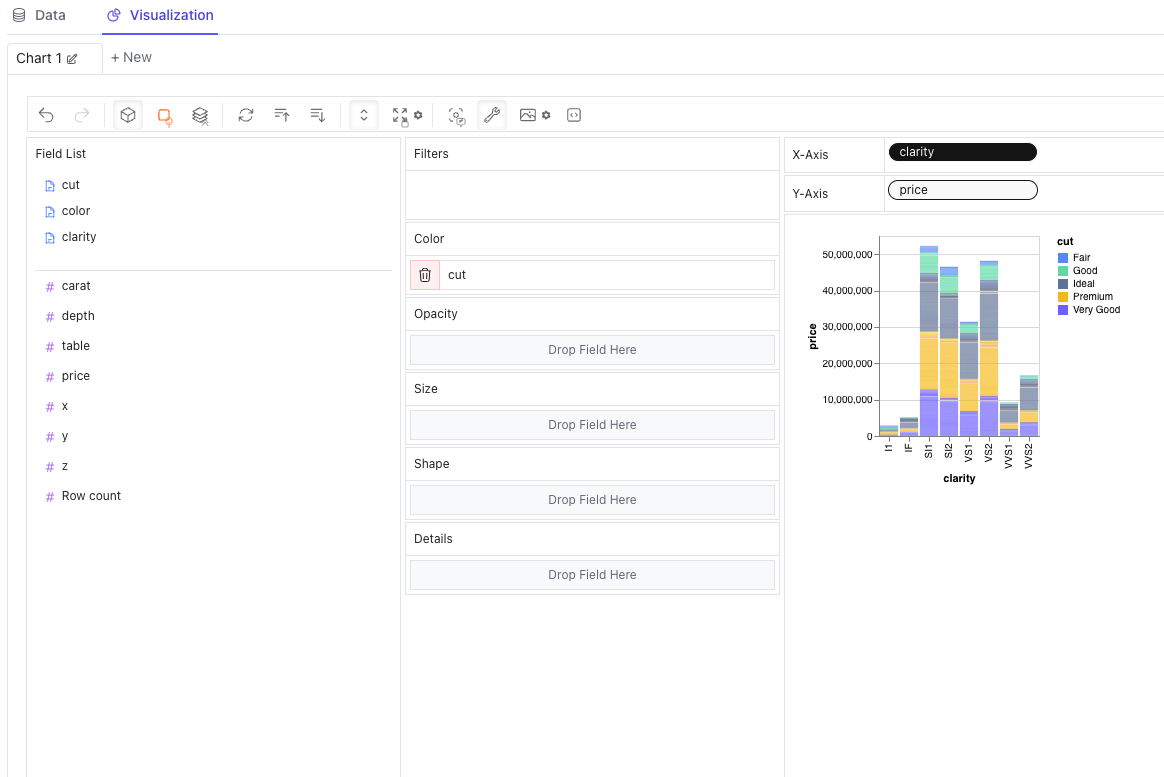
However, Rath's drag-and-drop analysis is still quite elementary. I believe this is just one of its additional features.
Summary
This article introduced the automated data exploration open source tool Rath, including how to install it and some basic usage. Rath's automated data exploration functionality is quite powerful, allowing data exploration to be completed with just a few mouse clicks on the page. You should know that previously this required manually checking and analyzing chart by chart, which was very time-consuming. Rath precisely solves this pain point. Additionally, I checked the environment and found that Rath saves data through the browser's IndexDB, so there's no need to worry about data leakage. Overall, Rath is still in rapid iteration, with many features and documentation not yet perfect, but the future looks promising! I will continue to follow its development.
Community
If you're interested in my articles, you can add my WeChat tikazyq1 with note "码之道" (Way of Code), and I'll invite you to the "码之道" discussion group.