Practical Data Analysis: Building a Self-Service Data Analytics Platform with Open Source Superset

Introduction
Data Analytics and Business Intelligence are important business modules for many enterprises to implement digital strategies. We previously introduced indispensable parts of the data field in 《浅谈数据:数据领域需要掌握些什么?》, namely software tool auxiliary services in architecture and processes. The open source data analysis platform Apache Superset introduced in this article can provide such services. This article will briefly introduce how to install, deploy, and use Superset.
Superset Introduction
Superset is an open source self-service data analytics platform incubated by the Apache Foundation. It can be seen as an open source version of Power BI or Tableau, though Superset's interactive interface is limited to Web. The entire system is based on Python Flask and integrates with mainstream relational databases like MySQL, Postgres, SQL Server, as well as modern databases like ElasticSearch, ClickHouse, Snowflake. The frontend visualization analysis interface is very similar to Power BI and Tableau, with relatively simple operations. Therefore, if you need to build an enterprise-level data analytics platform like Power BI or Tableau without spending money, Superset is an excellent choice.
Installing Superset
The simplest way to install Superset is through Docker containers. For friends unfamiliar with Docker, you can check Docker's official website or related materials, or skip this section and have tech-savvy friends help with installation.
Assuming you've already installed Docker and Docker Compose, you can now create a container configuration docker-compose.yml file at a specified location with the following content. We've added a MySQL container to provide database services.
version: "3.3"
services:
  superset:
    image: apache/superset
    container_name: superset
    volumes:
      - "./startup.sh:/opt/startup.sh"
    ports:
      - "8088:8088"

  mysql:
    image: mysql
    container_name: mysql
    environment:
      MYSQL_DATABASE: "superset"
      MYSQL_ALLOW_EMPTY_PASSWORD: "yes"
Then, create an initialization script file startup.sh in the same directory with the following content. The demo data loading section is commented out - friends who want to see demo data can uncomment it.
#!/bin/sh

# create admin account
superset fab create-admin \
	--username admin \
	--firstname Superset \
	--lastname Admin \
	--email admin@superset.com \
	--password admin

# upgrade database
superset db upgrade

# load examples
#superset load_examples

# set up roles
superset init
Now that we've created the container configuration file and initialization script file, we can start the containers and initialize. Execute the following commands to start containers and initialize.
# start docker containers
docker-compose up -d

# initialize superset
docker exec -it sh /opt/startup.sh
After these operations are completed, we can open http://localhost:8088 in a browser to enter the Superset login page.
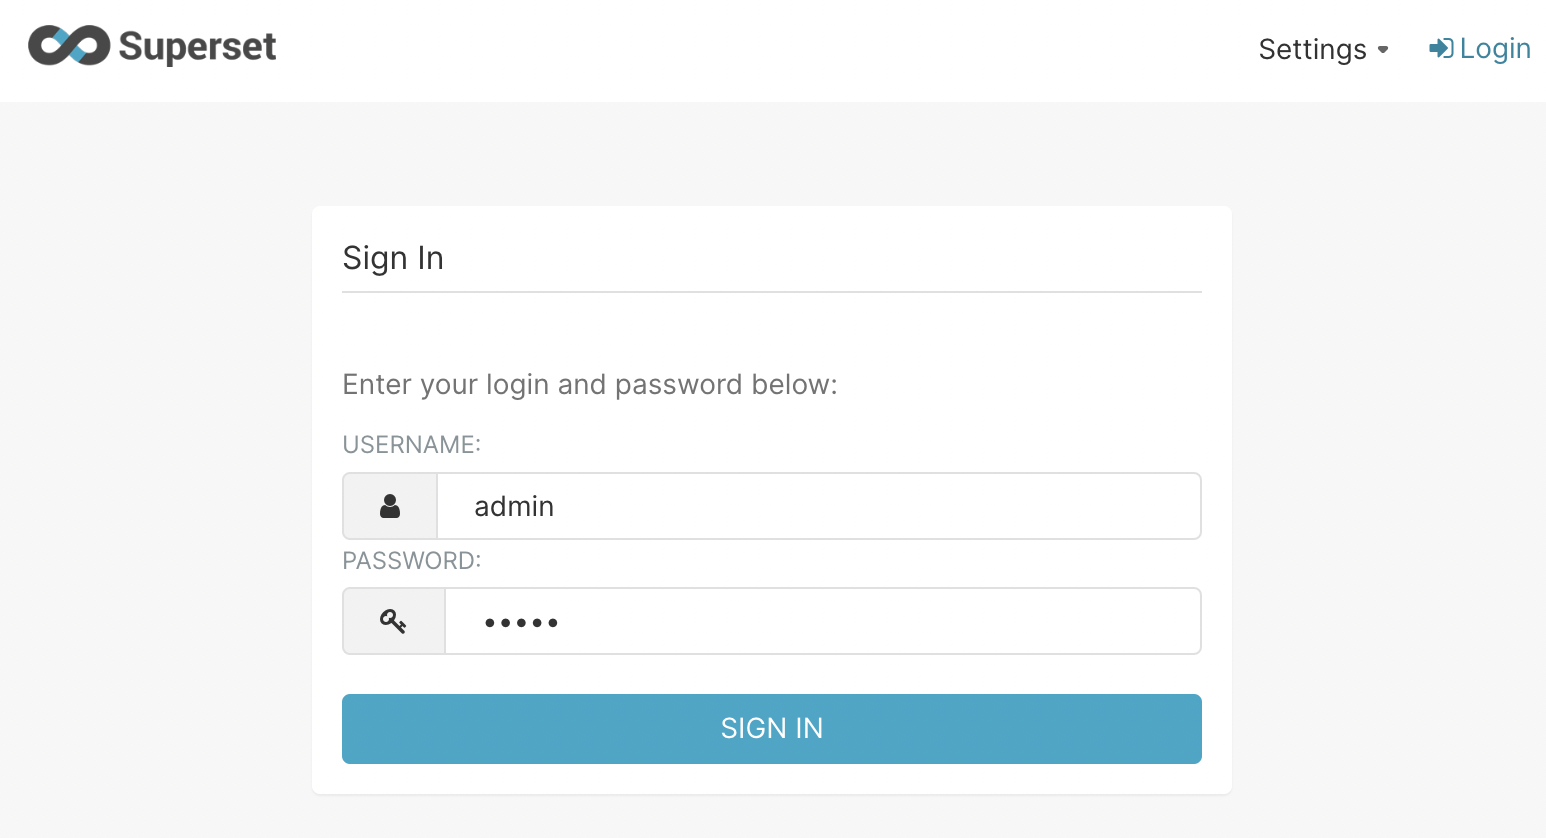
We can enter the default username and password admin/admin to access the interface.
Creating Your First Dataset
After logging into Superset, you'll find there's currently nothing (unless you previously uncommented the data loading). Now we need to perform two steps to create our first dataset.
Connecting to Database
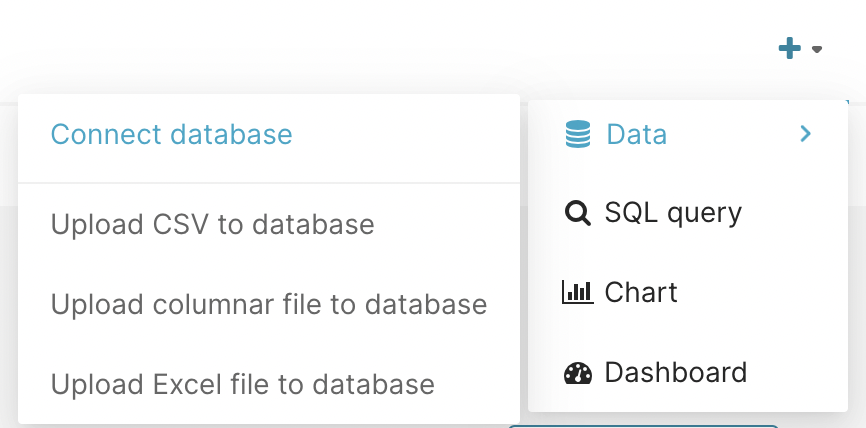
Hover your mouse over the plus button in the upper right corner, continue hovering over Data, then click Connect database.
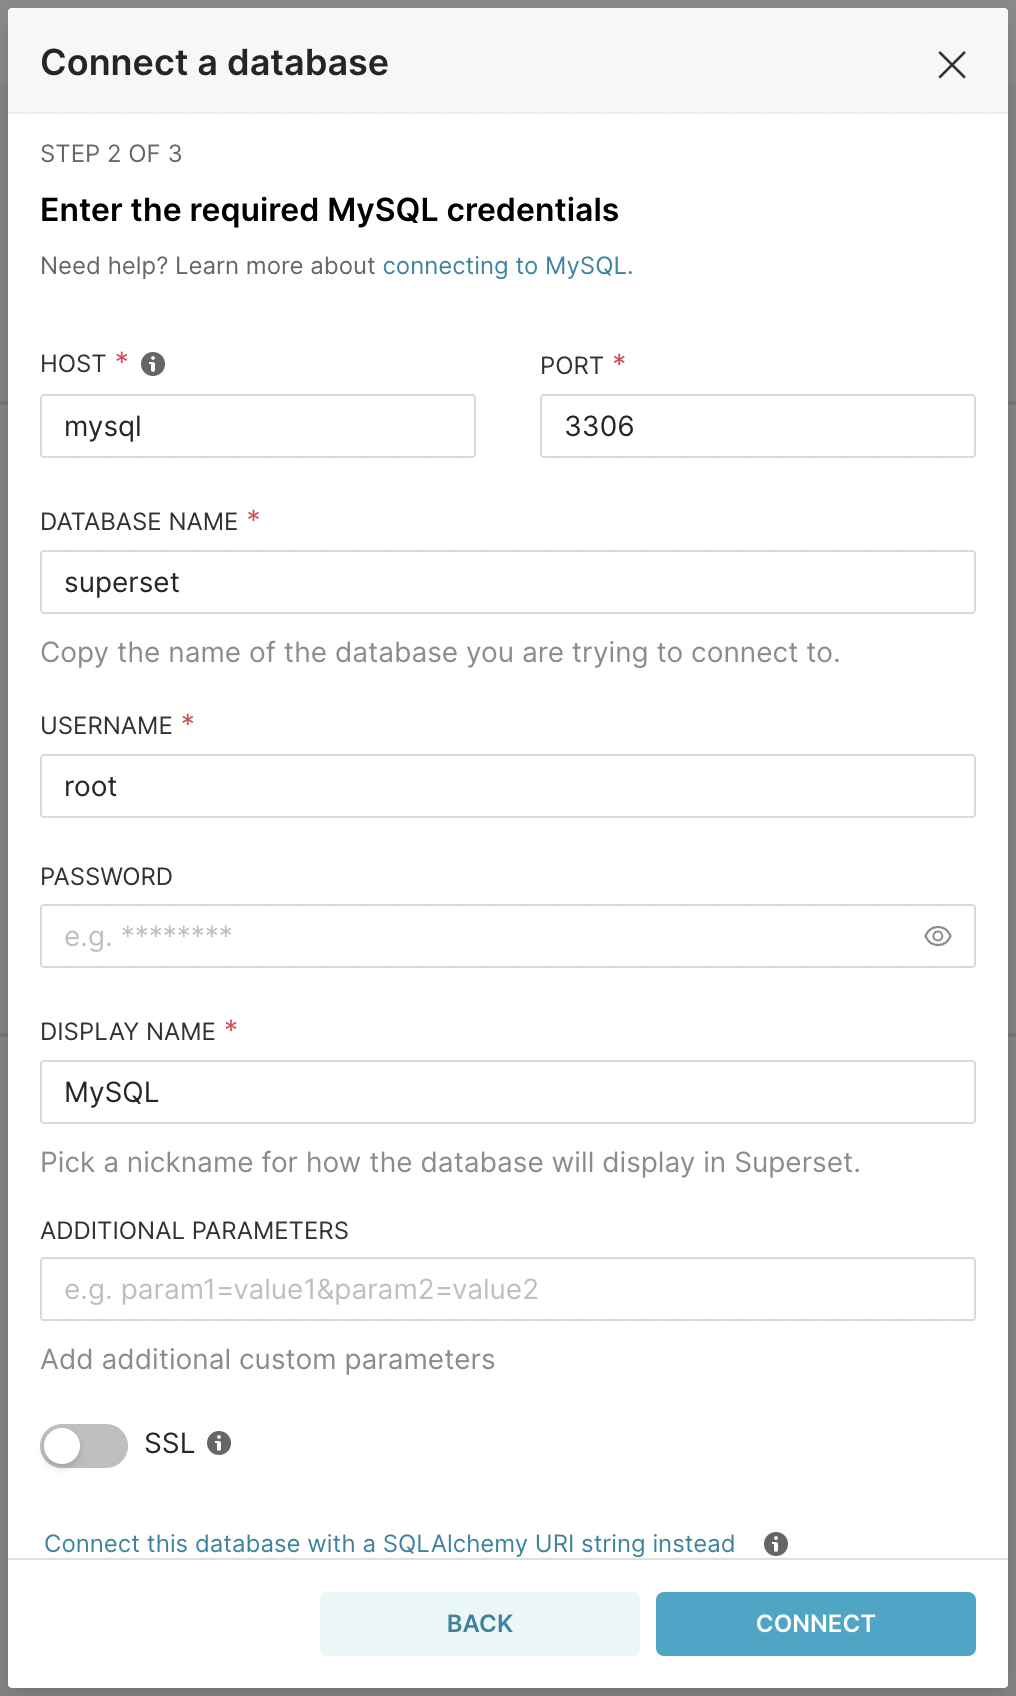
When the popup appears, select MySQL and enter database connection information as shown below. Then click Connect, continue clicking Finish to complete the database connection.
Setting Up File Upload Permissions
To quickly experience interactive data analysis on Superset, we'll choose to upload an Excel data file to Superset.
However, before that, we need to take one more step - allowing file uploads in MySQL. This can be configured through the Superset interface. The steps are as follows:
- In
Settings, clickDatabase Connections; - Edit the MySQL database we just created;
- Click
Advanced, underSecuritycheckAllow file uploads to database, then confirm.
Great! Now we can upload Excel files!
Uploading Excel Data Files
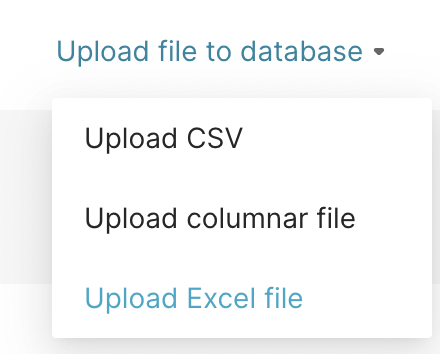
In the upper right corner, click Upload file to database then click Upload Excel file.
Then, on the Excel upload page, select the file to upload, enter the table name as sales, click the Save button below to create the dataset.
For the upcoming data analysis demonstration, we'll use the Sample Sales Data dataset from Kaggle. Since uploading its default CSV file to Superset has database encoding issues, I've converted it to an Excel file and uploaded it to GitHub, which can be downloaded via GitHub link.
After uploading the Excel data file, you can see the created dataset in Datasets.
Next, let's see how to analyze this data in Superset.
Analyzing Sales Data
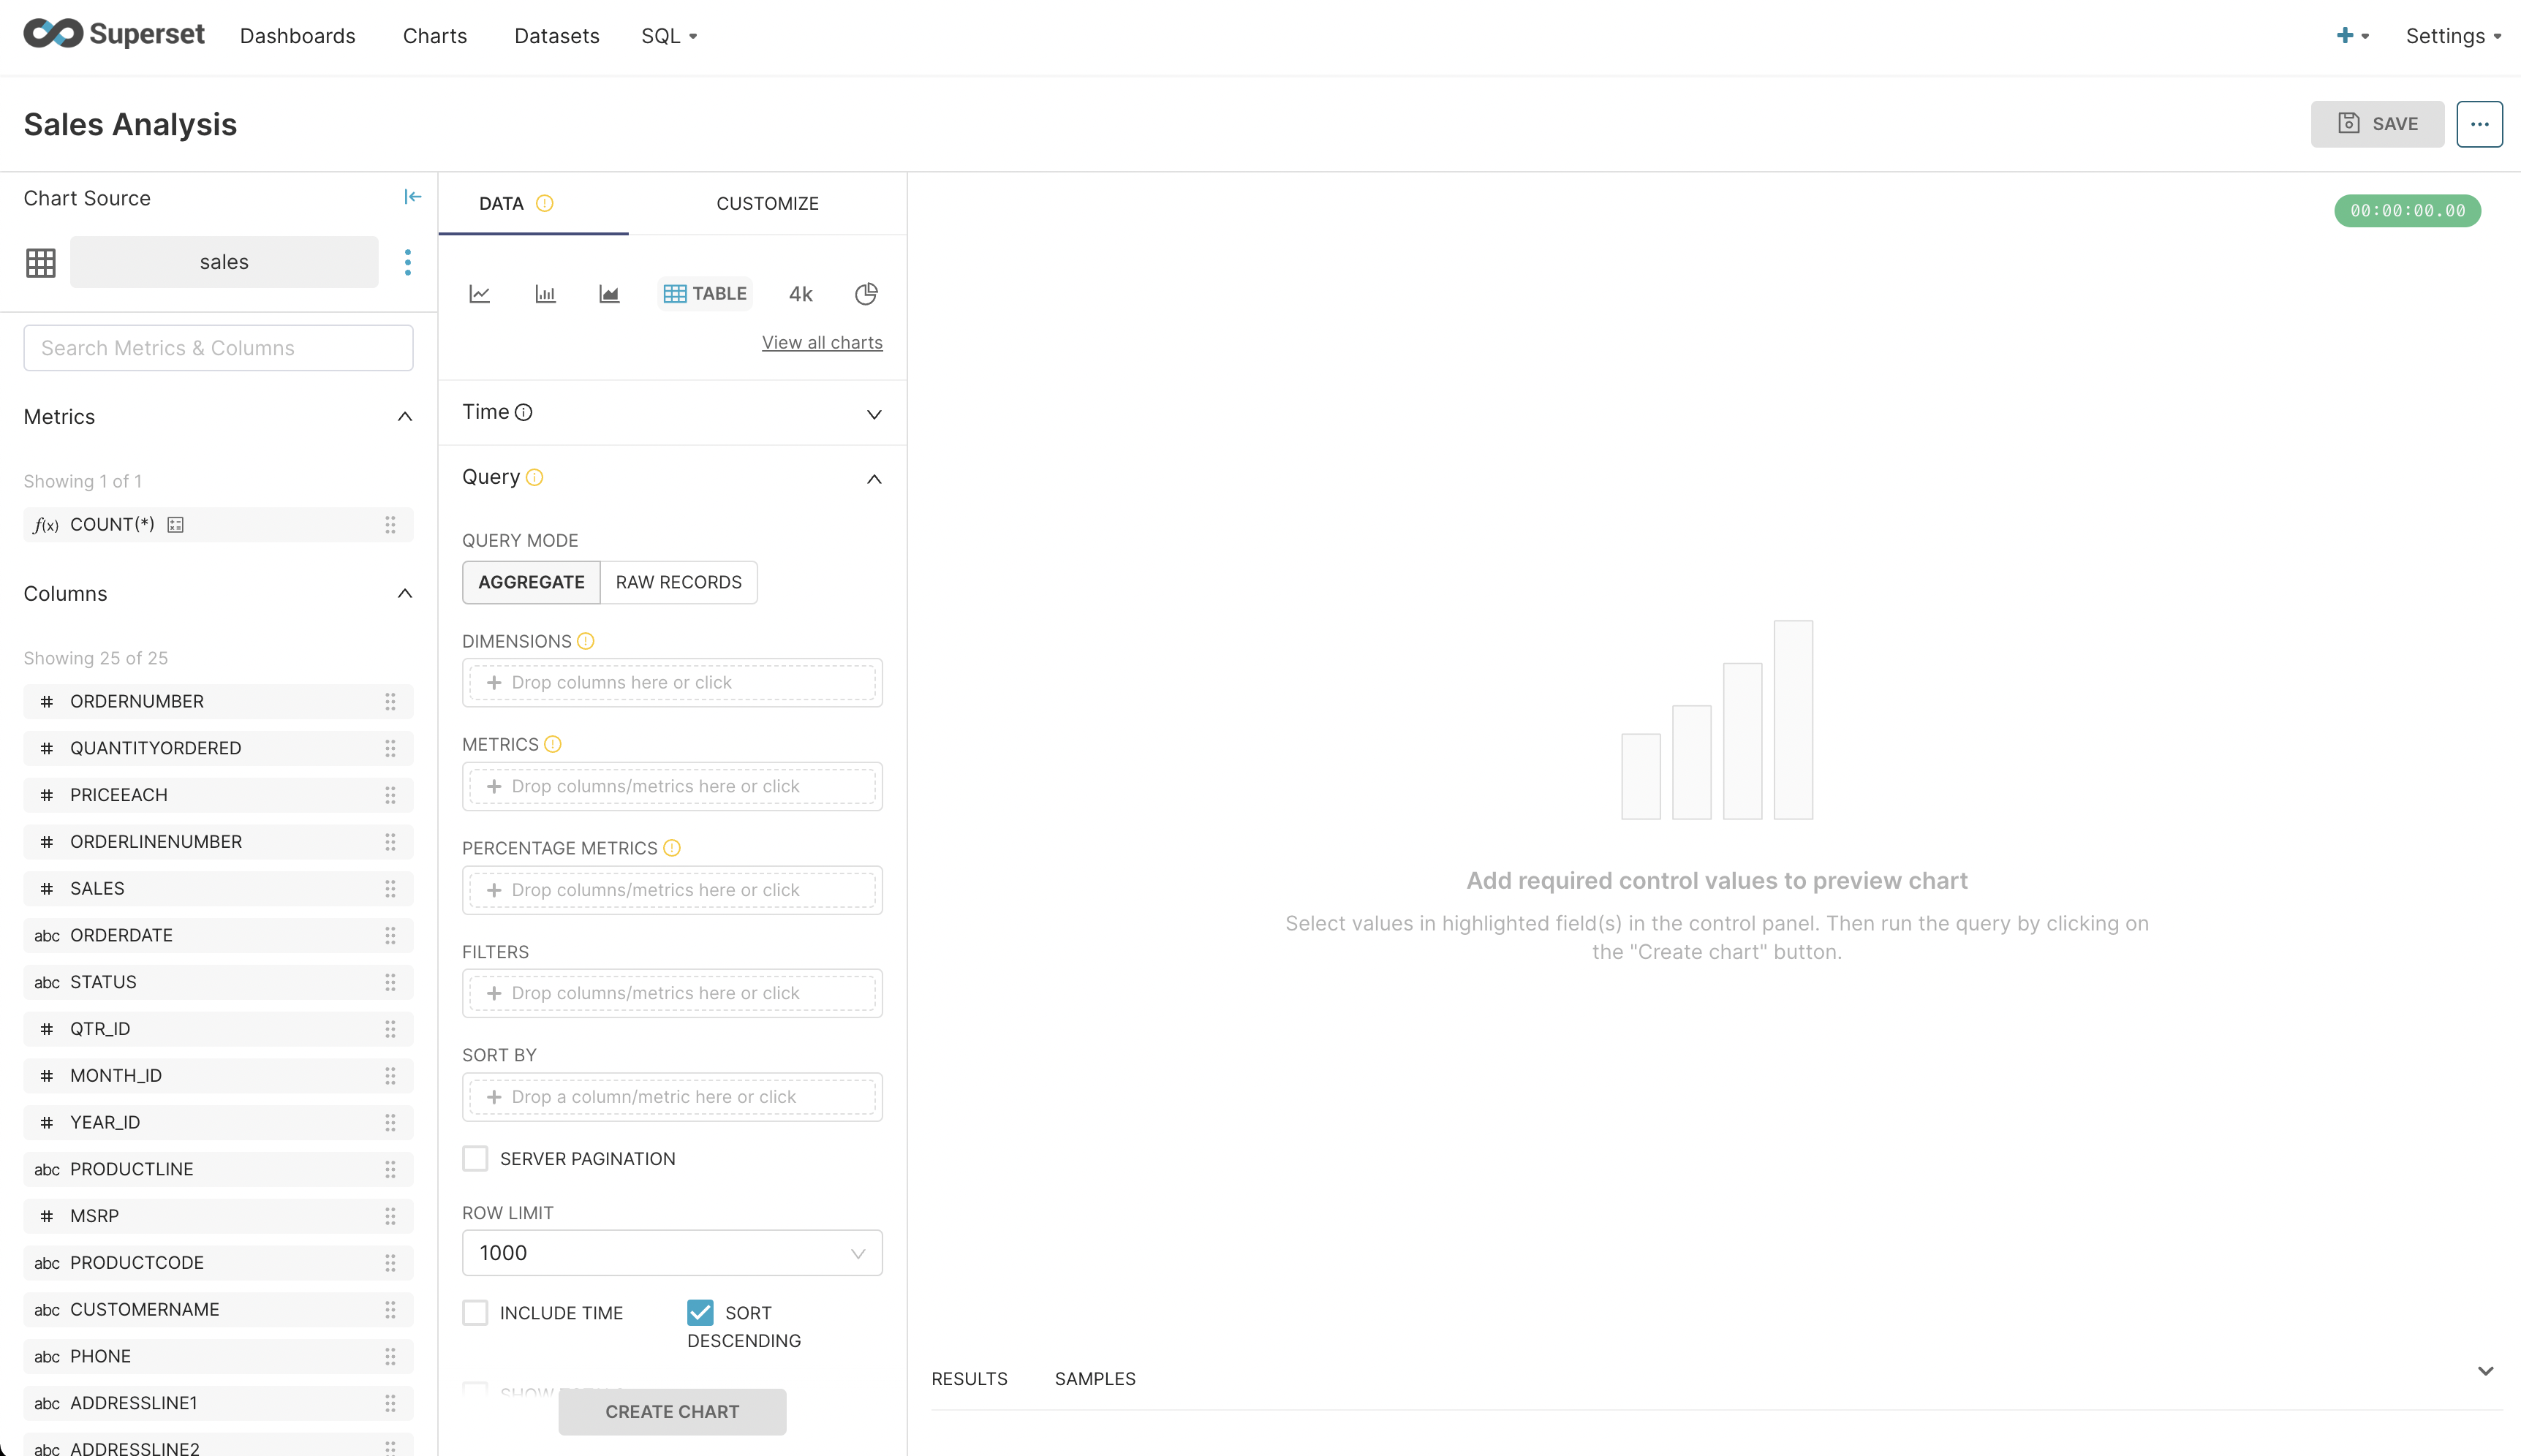
Click on the sales dataset we just created to enter the analysis page. If you're familiar with Power BI or Tableau, you'll find this is essentially Power BI's Visual or Tableau's Chart. The leftmost side shows various fields of the dataset, next to it is the data operation area, and the right side is the chart display area.
Seasonal Analysis
Now, we want to see quarterly sales figures. Drag SALES from the left to METRICS and select SUM; then drag YEAR_ID and QTR_ID to DIMENSIONS; then click CREATE CHART. We can see the following statistical table.
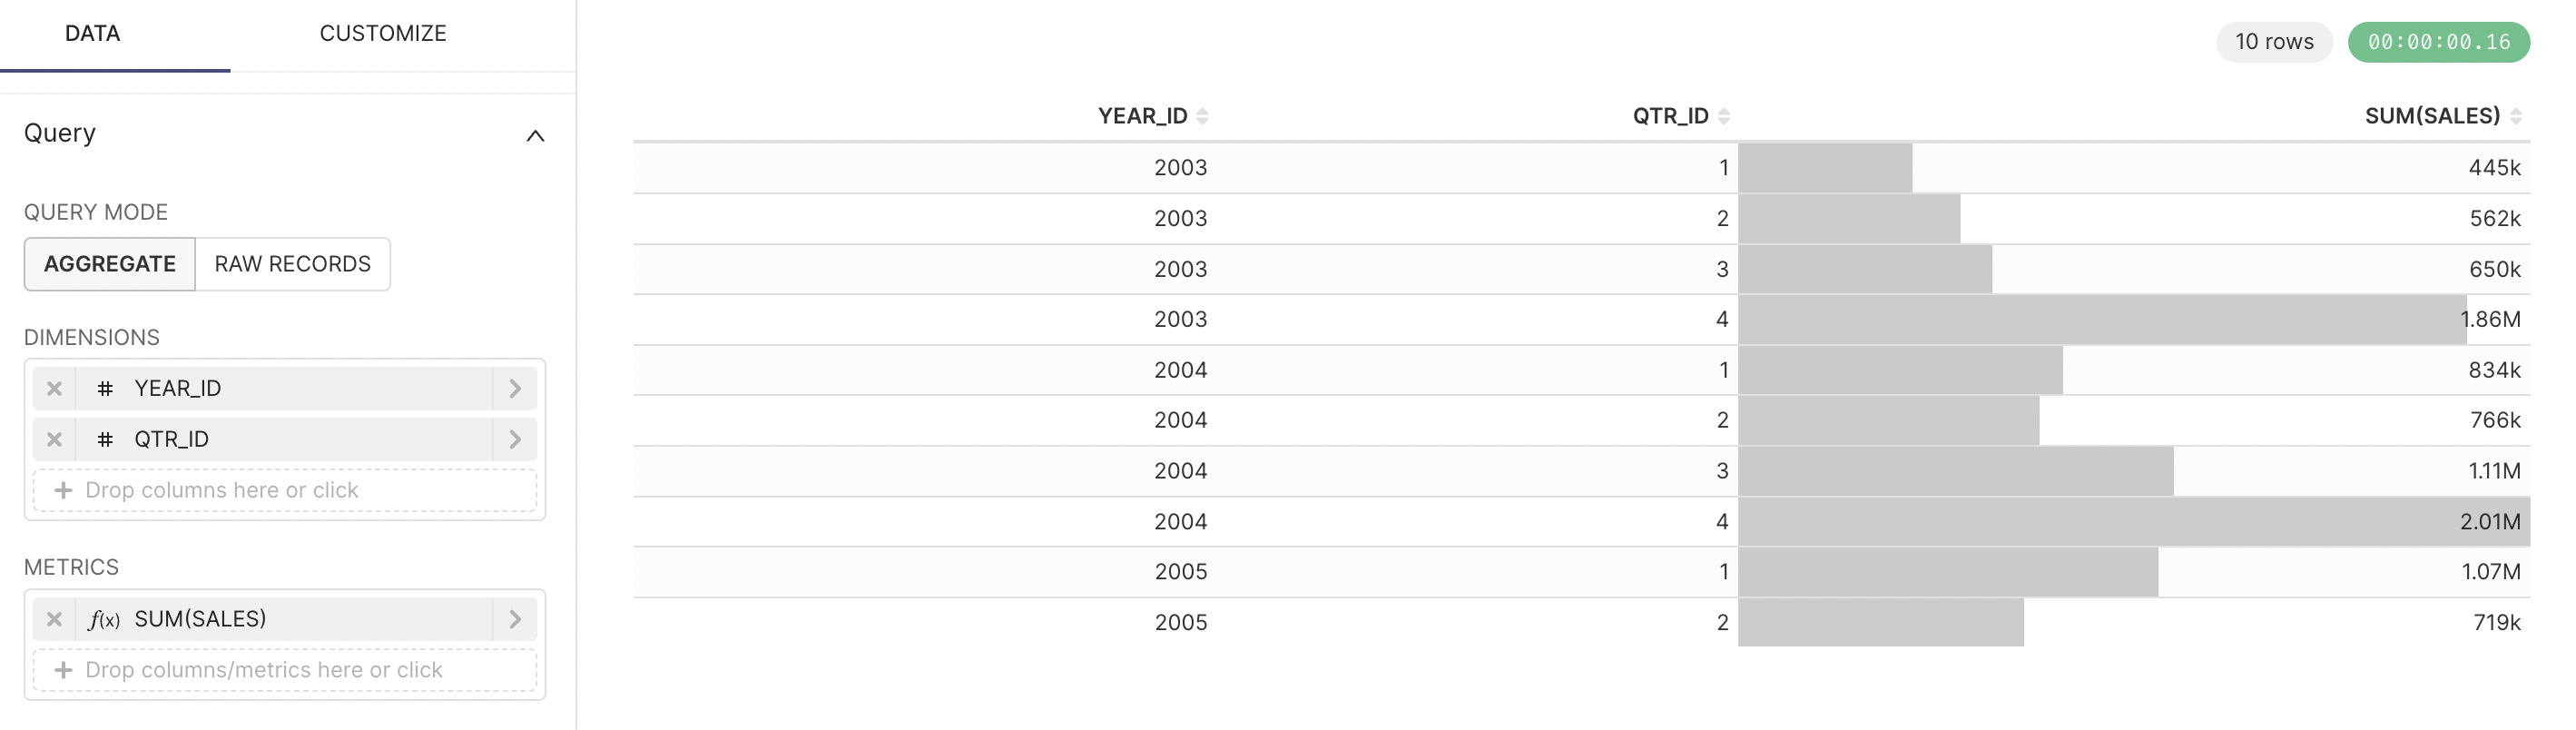
From the above chart, we can see that sales seem to be affected by seasonality: each winter, the fourth quarter, has substantial sales volumes. This is because European and American countries make large purchases of holiday gifts and supplies during Christmas, resulting in higher sales. Therefore, this discovery isn't surprising.
Correlation Analysis
Next, we want to examine the relationship between Quantity Ordered, Price Each, and Deal Size. We select View all charts, choose Bubble Chart, input relevant fields, and generate the following bubble chart.
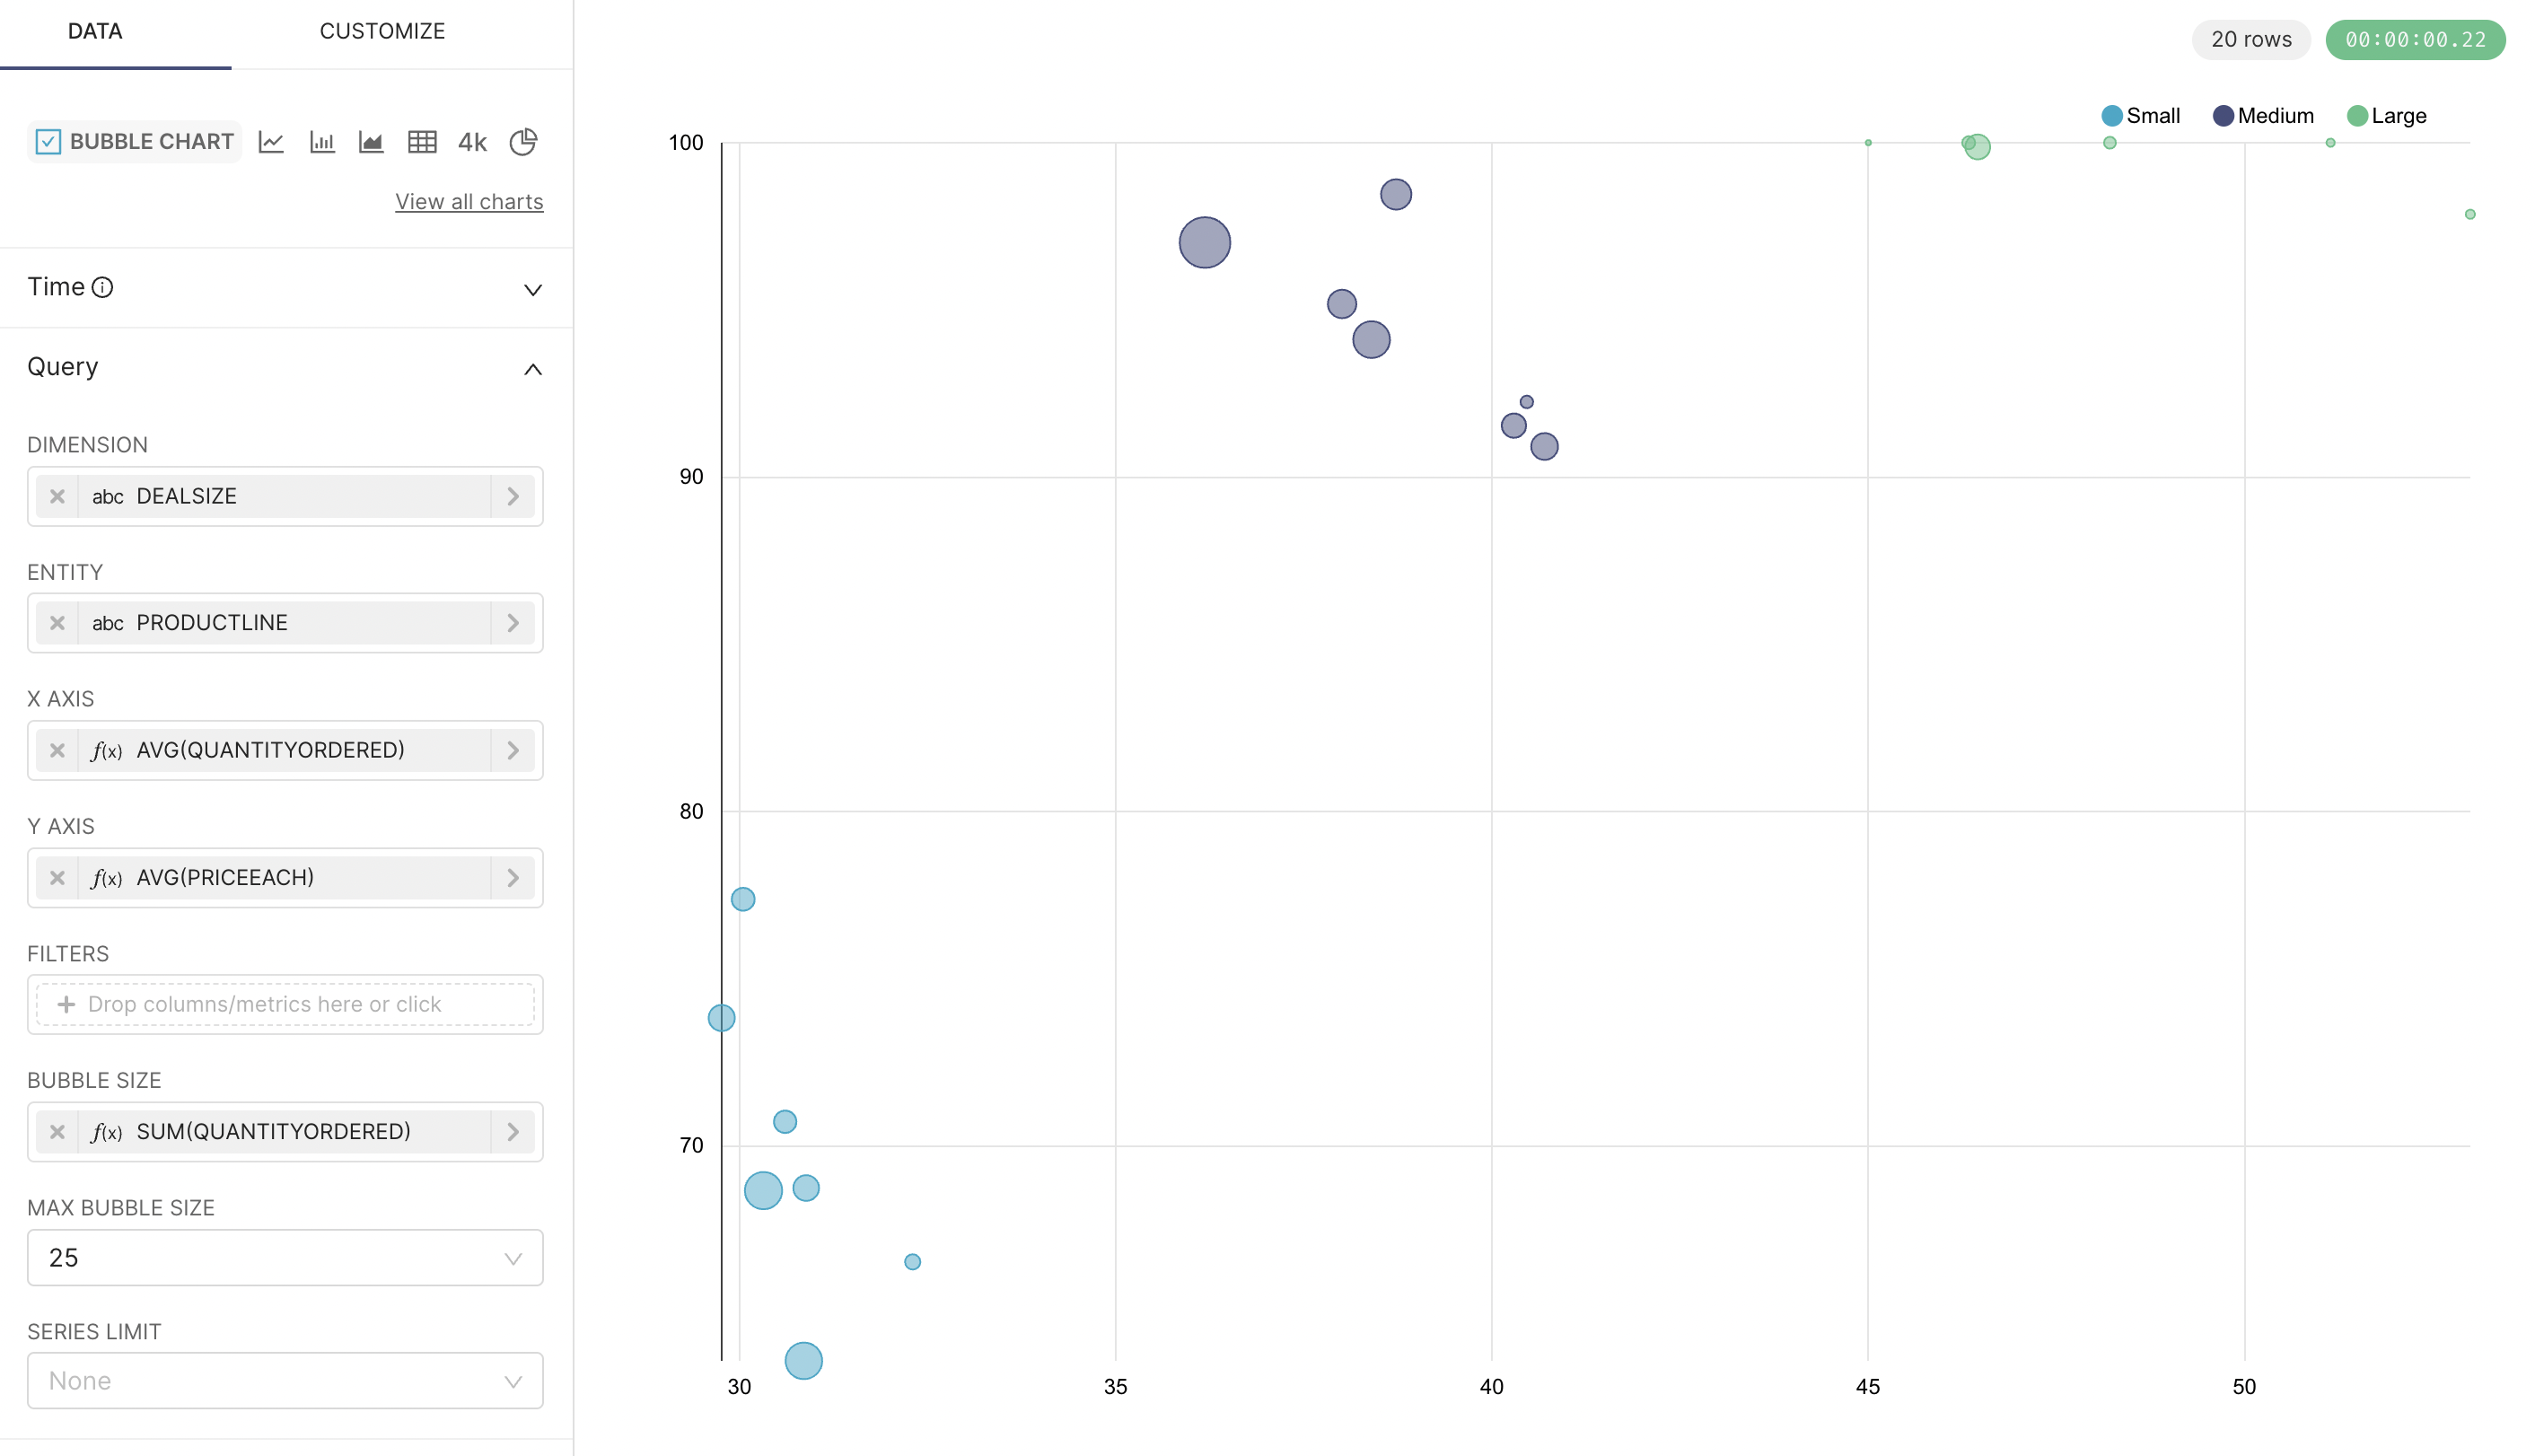
We can see that the larger the deal size, the higher the order quantity; while price has no obvious correlation with order quantity.
Through the above, we created two simple charts with just a few mouse operations, completing simple visual data analysis. Although Superset's functionality doesn't yet match commercial software like Power BI and Tableau, it's completely sufficient for us free users!
Summary
This article introduced how to set up and install Superset, create datasets on Superset, and perform visual analysis through drag-and-drop methods, helping us experience and understand Superset's capabilities in data analysis. As an open source project incubated by the Apache Foundation, Superset is an excellent data analytics platform that can serve as a choice for small and medium companies, especially for programmers with some operational experience. However, Superset still doesn't match commercial software like Power BI and Tableau in terms of functionality, usability, and technical ecosystem. For example, Power BI's Gateway allows it to easily connect data from various systems - it's actually more than just a data visualization tool, but Power BI's commercial licensing is also very expensive. Superset has other features like Dashboard, which this article didn't cover due to space limitations - we'll introduce them in detail when there's an opportunity.
Community
If you're interested in my articles, you can add my WeChat tikazyq1 with note "码之道" (Way of Code), and I'll invite you to the "码之道" discussion group.